![]() MODULE FOCUS
MODULE FOCUS

Transparent and
Comprehensive is faster.
ReportViz – the flagship module of ICI’s RIVAS project information management system for Regional and Strategic Assessments, project-specific Environmental Assessment, and overall project planning.
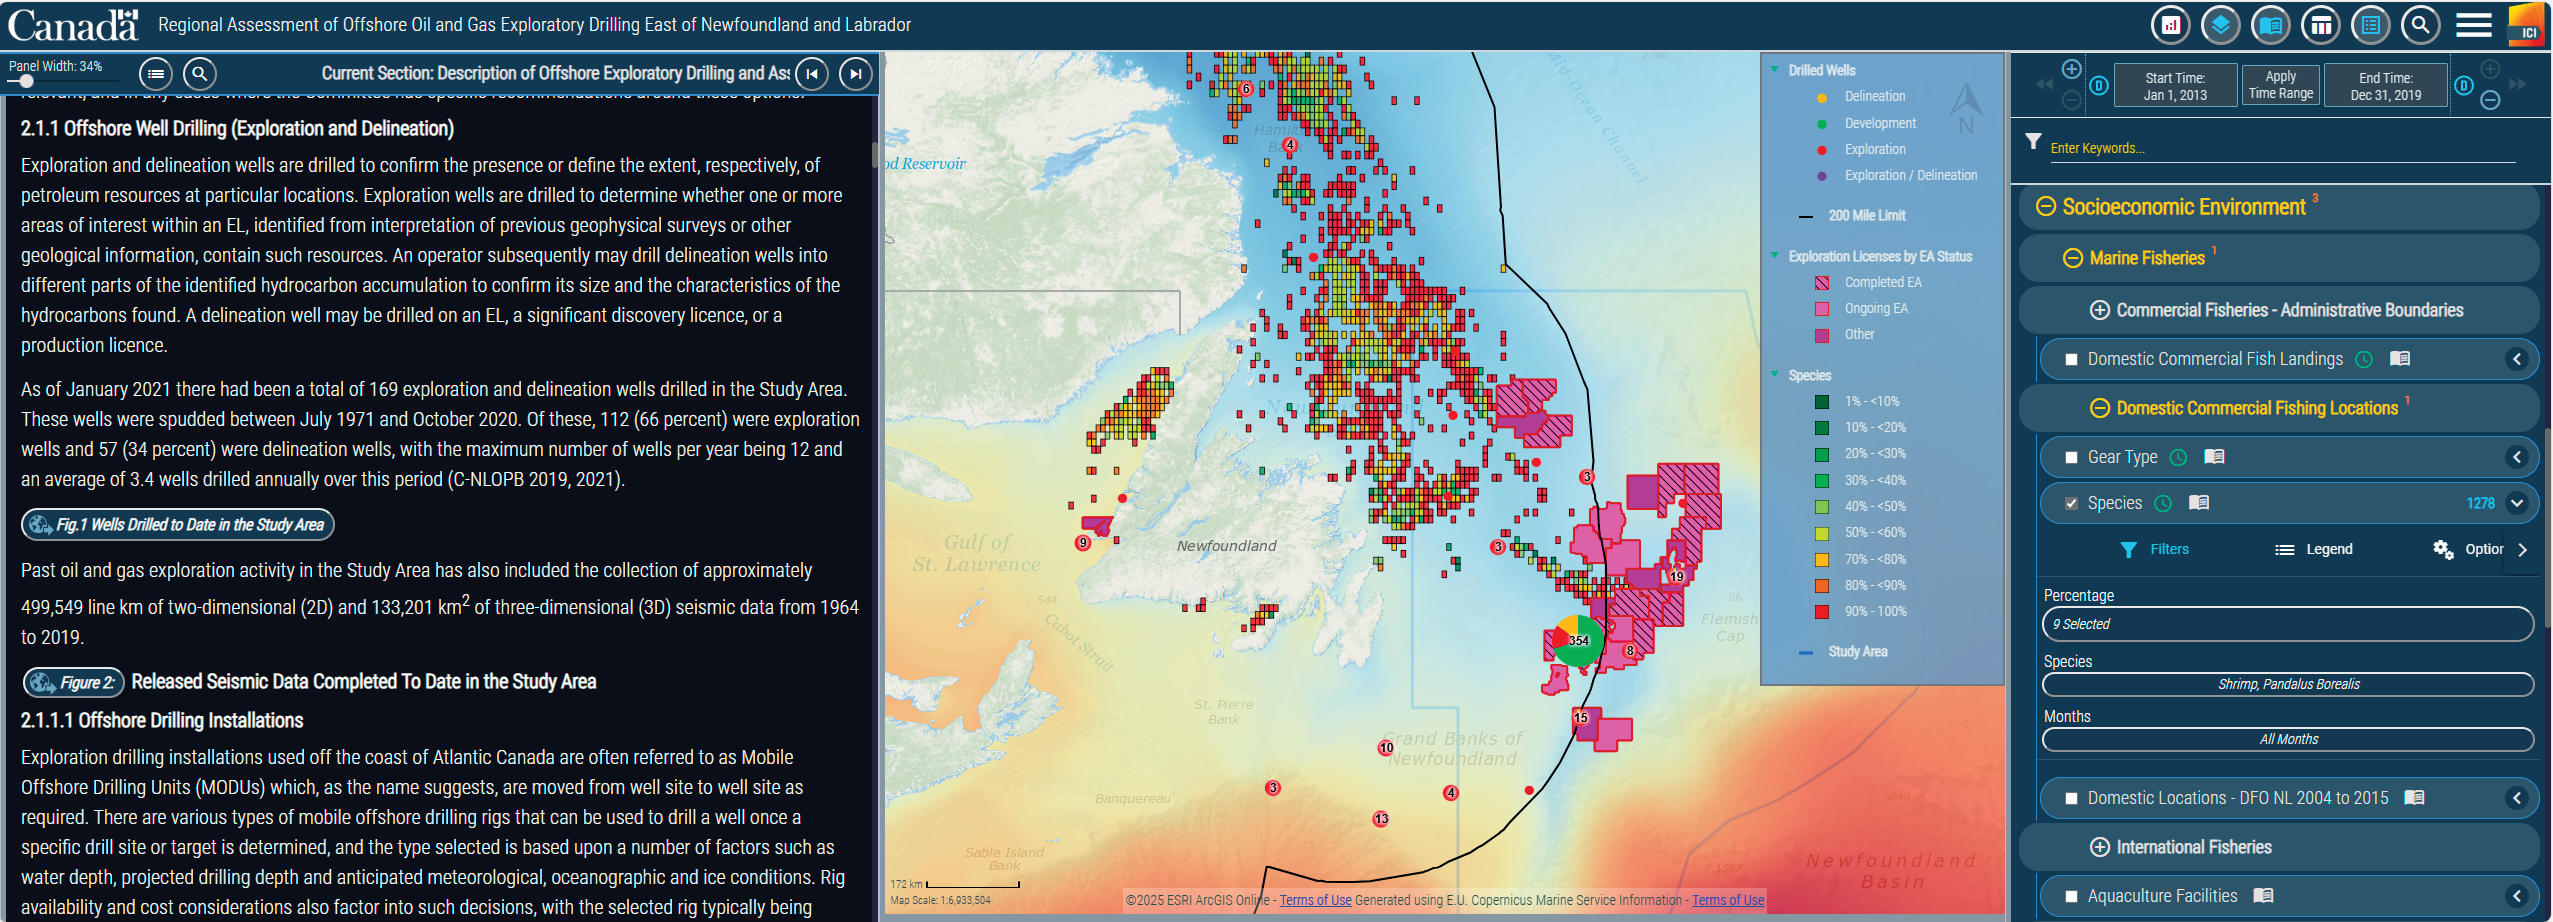
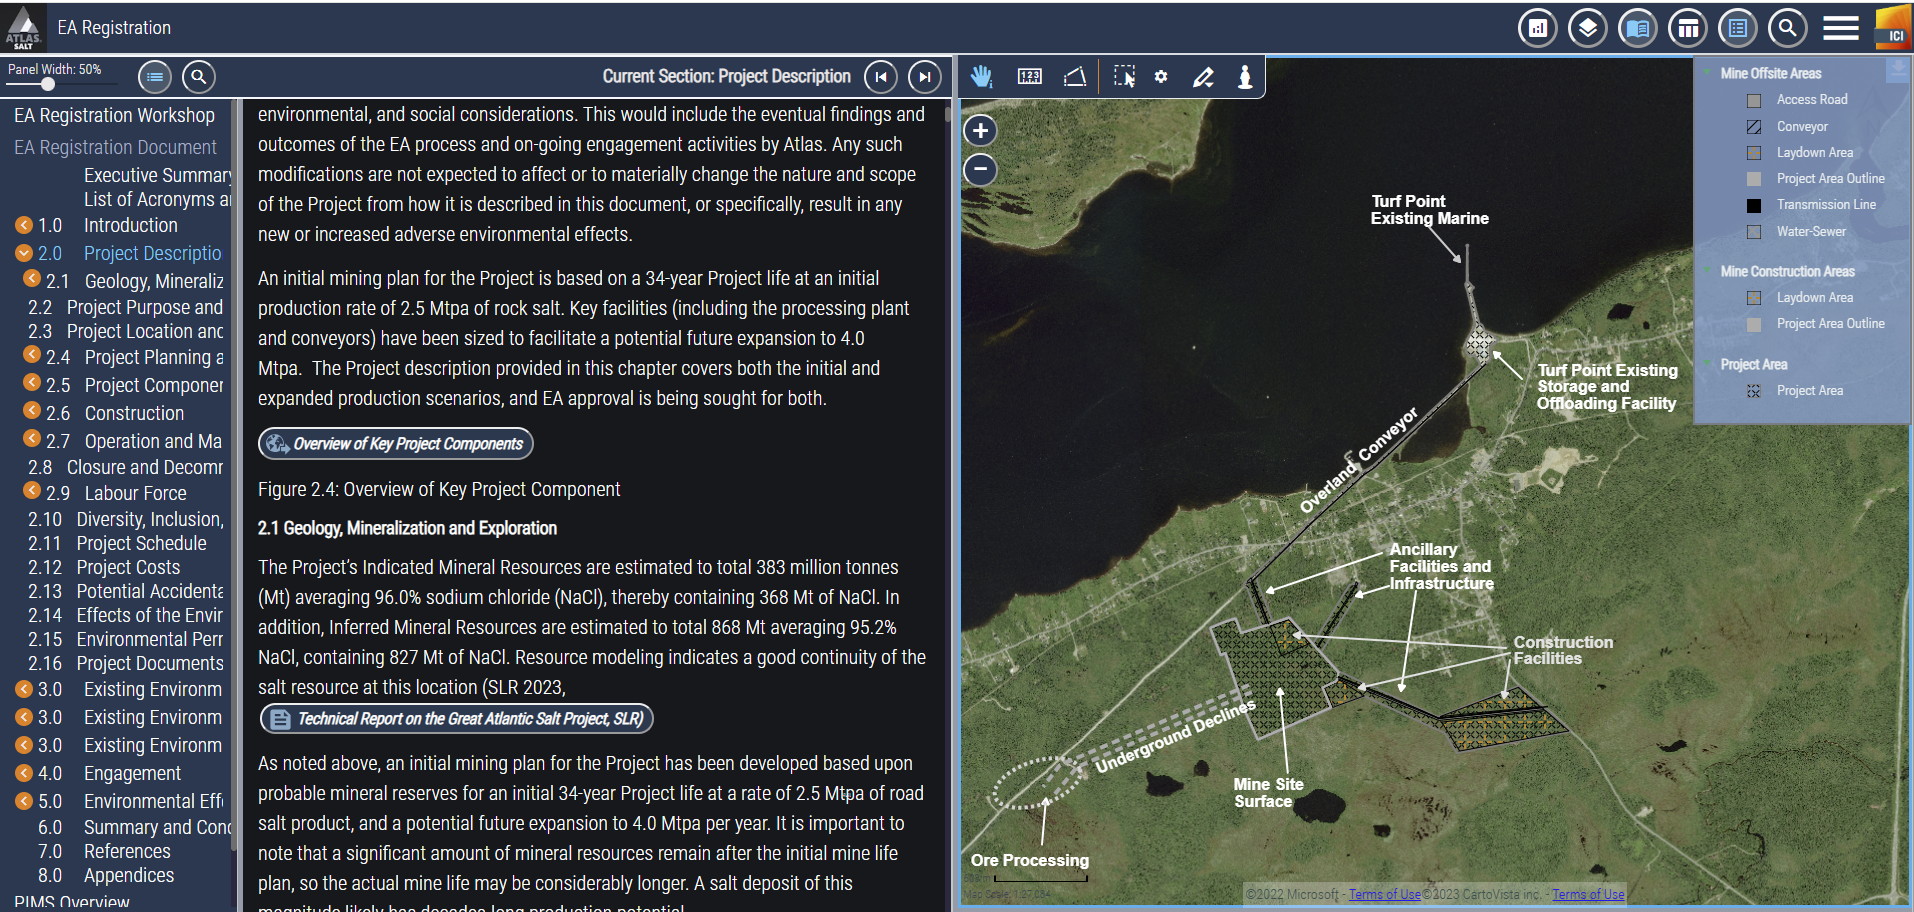
Easy navigation of reports guides the presentation of information for the user with linked figures and maps. Intuitive controls enable interaction with data, information and supporting documents (third-party reports, external resources etc.)
interactive Report
- Reports authored in MS Word,
auto-published to ReportViz - Intuitive navigation of reports
- Figures linked to map panel
- Searchable report content
vizualization
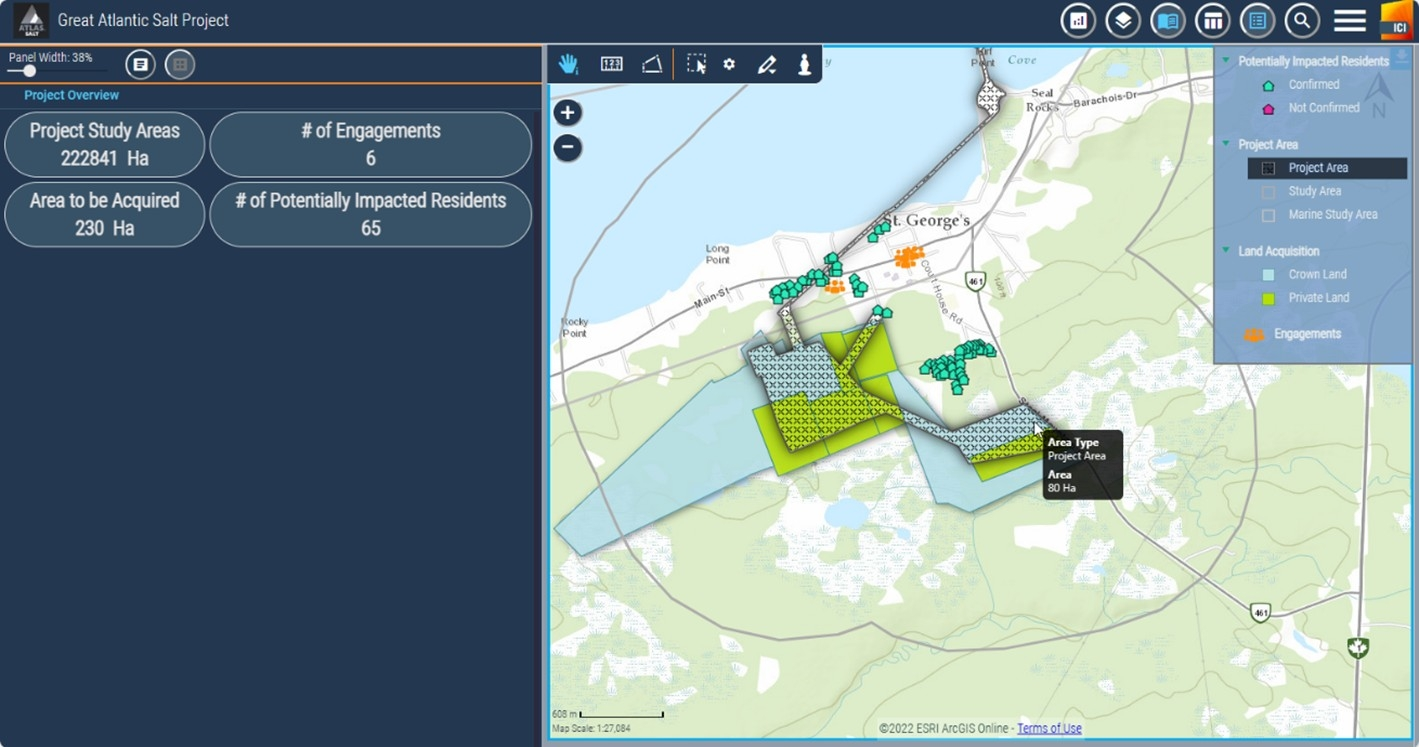
- Defined Views – layers, data
- Custom Annotations
- Pan, zoom, query map data
- Dynamic spatial selection
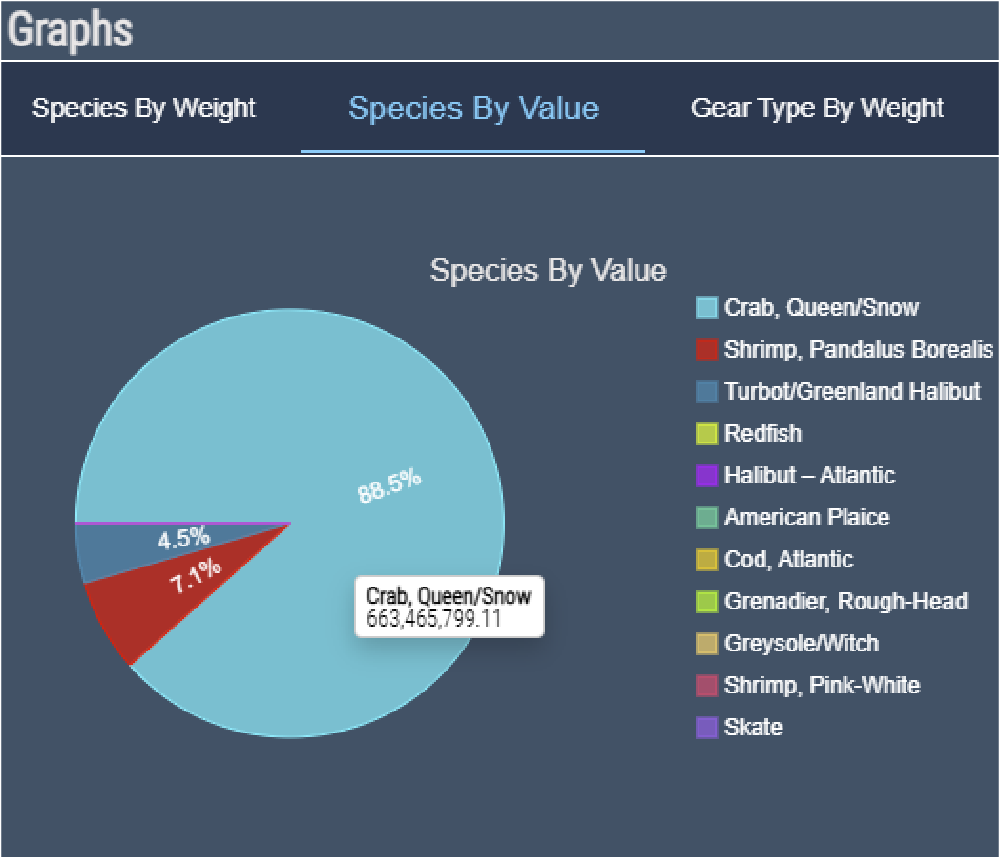
- Data – tables, charts, analysis
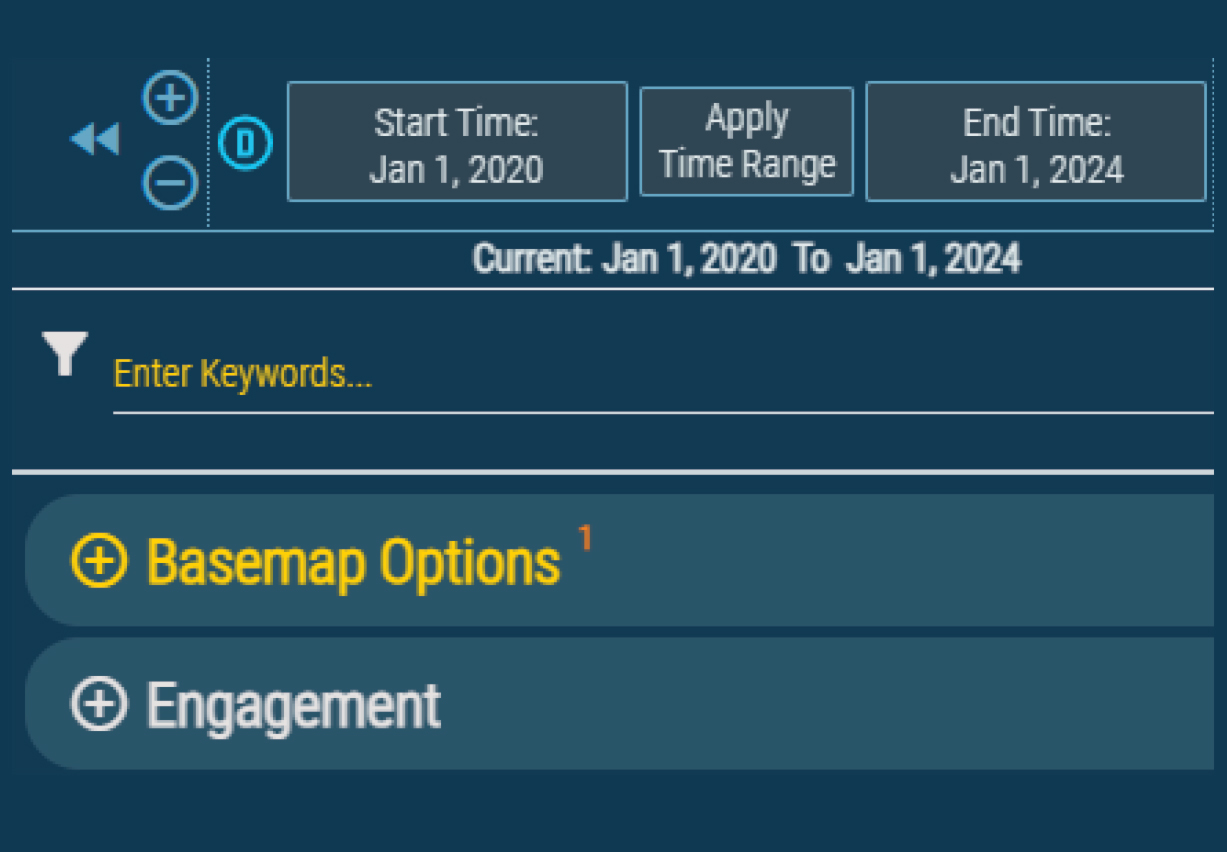
navigation
- Layer control
- Time slider
- Search data
- Data source
- Filter data
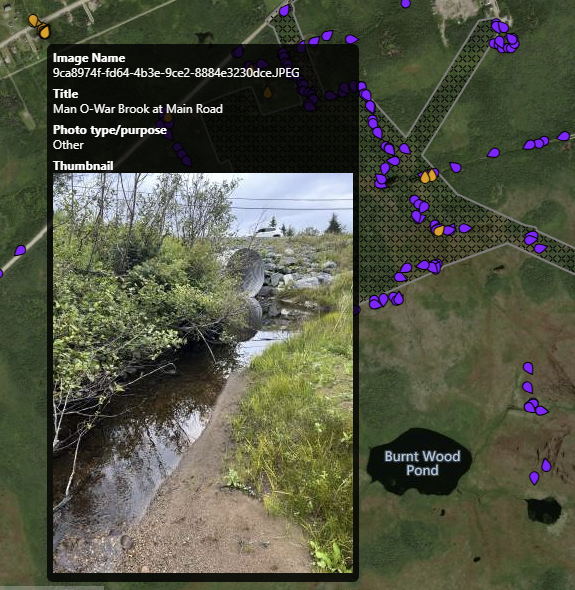
pictures & Presentations
- Upload pictures from the field via email
- Integrated to project, stored and organized
- Location, orientation, date, time retained
- Hover-over icon + full-size photo
- Integrated PPT presentation with figures linked to Map and data layers
tables & Dashboards
- Query data by map, time, type
- View in Dashboard or Table
- Export or copy in table format
- Filter, sort, reorder and analyze
- Statistical analysis functions
“ICI Solutions has been an invaluable partner in advancing our project. Their platform, ReportViz, enabled us to complete our environmental assessment in just 52 days—remarkably faster than industry norms. The interactivity and centralized data streamlined our operations and improved communication with regulators, making ICI a standout in the industry.”
who uses reportVIZ?
- Executives – project overview presentation
- Managers – internal/external collaboration
- Technical Staff – consolidating information
- Consultants – integrating expert content
- Partners – engaging
- Indigenous/Community Shareholders – sharing with investors
- Regulators – efficiency, transparency, trust
- Public – enhanced collaboration via data availability and transparency
industries Served
- Fisheries
- Mining
- Oil and Gas
- Renewable Energy
- Transportation and Logistics
- Utilities and Infrastructure
- Municipalities
- Interactive Data Visualization and Reporting
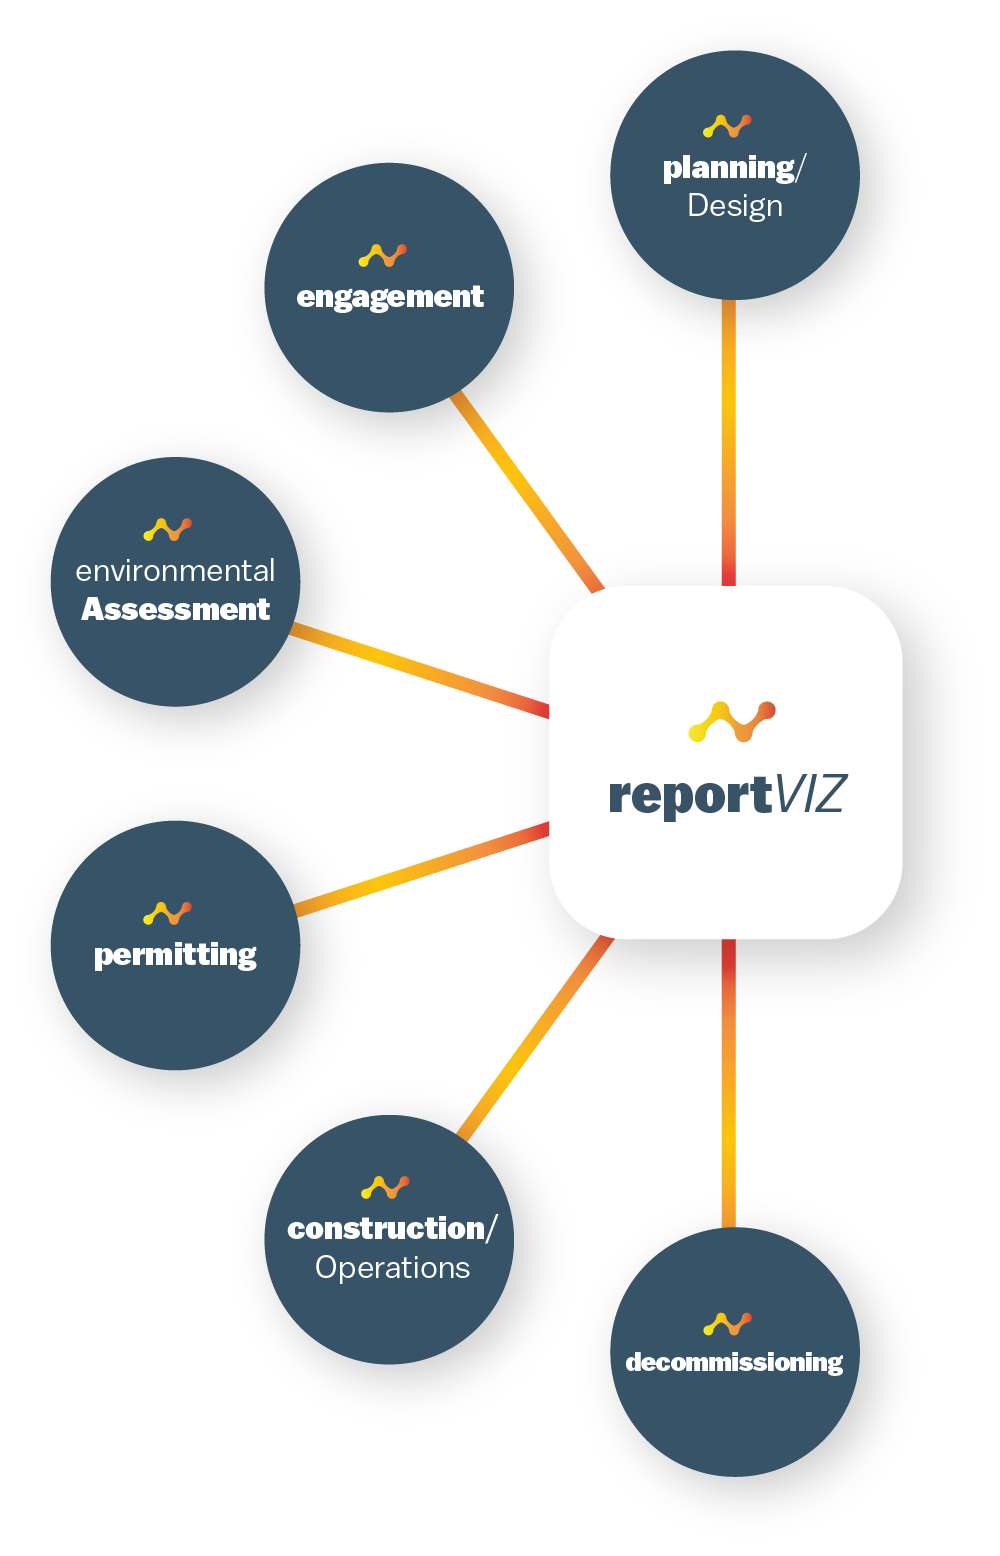
reportVIZ use cases
Regardless of what stage your project is in – ReportViz will help move your project forward faster, without cutting corners or missing critical steps.
Planning /Design
Information structured, organized and prepared. Enables impactful engagement with stakeholders.
Engagement
Centralized, visual, and interactive. Allows for effective dialogue with regulators and the public. Local knowledge captured with the click of a button.
Digital EIA
EIS Sections, data, and supporting reports are interactive and made available to regulators. Reduces burden of large static reports.
Permitting
Additional required regulatory permits. Faster project approvals due to transparent and holistic provision of information to regulators.
Construction / Operations
Real time data can be uploaded to reflect project phase / status. Show compliance with regulatory approvals.
Decommissioning
Decommissioning status visualized in ReportViz. Demonstrate progress of decommissioning for regulators.
