Oil and Gas Corporation of Newfoundland & Labrador
Flooded with geoscience data, an energy company turns to ReportViz to create the compelling intelligence it needs to manage its data, while exploring the offshore.
Creating Compelling Intelligence with ReportViz
The Oil and Gas Corporation of Newfoundland and Labrador (OilCo) is a major Canadian energy company headquartered in St. John’s. A Crown corporation, OilCo is charged with leading the management and development of the Province’s offshore oil and gas resources.
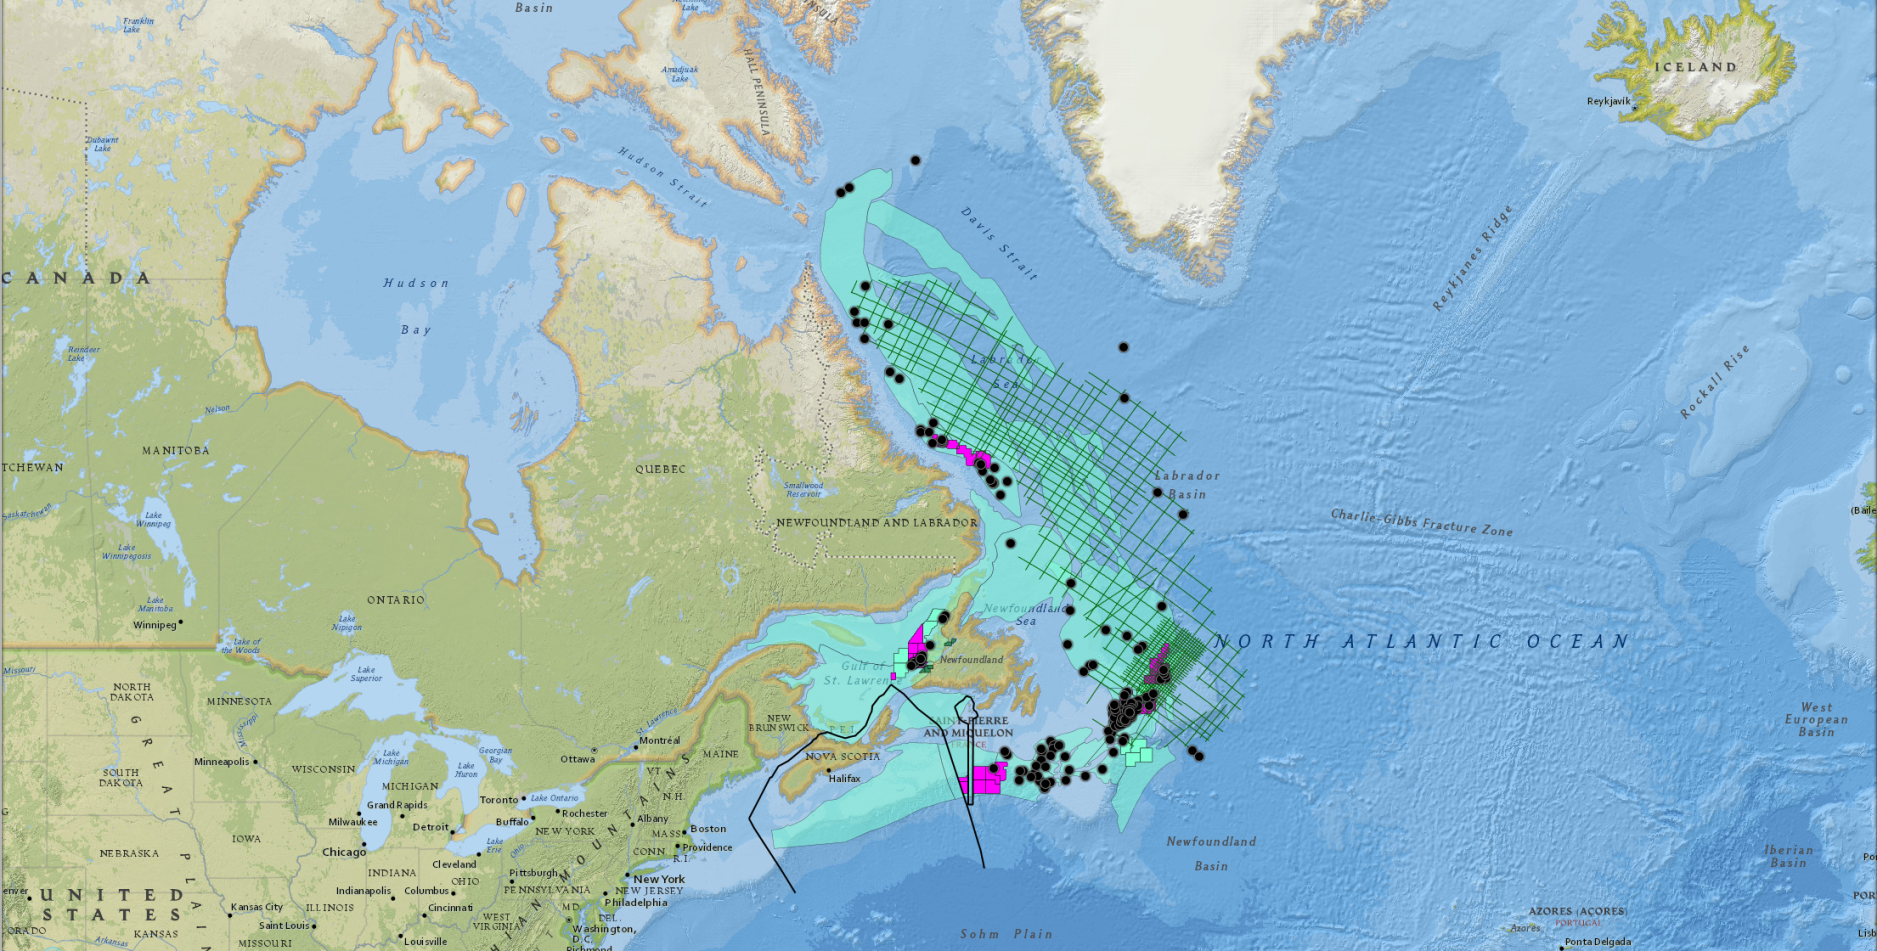
Current offshore oil and gas projects are concentrated in the Jeanne d’Arc Basin (340 km off the Newfoundland and Labrador coast), but more oil and gas discoveries may be waiting in other basins that are comparatively underexplored.
To find and deliver new resources in these basins, OilCo is executing an exploration strategy based on global best practices. Under this strategy, in 2010 the company invested in two scientific studies in the Northwest Atlantic: first a satellite study of natural oil seeps on the ocean surface, then one of the largest seismic surveys ever done of the ocean floor to find potential petroleum reserves.
As a result, OilCo has defined new areas that hold the potential for petroleum discoveries.
The Challenge:
OilCo’s Exploration Department needed a system for managing the seismic data and other geoscience information it collects so that company knowledge and insight on the potential of these offshore areas could be captured, preserved, and effectively communicated.
But seismic data is complex, and difficult for non-specialists to interpret in its native formats. The company also wanted to connect this data to other information it possessed: data about existing and planned wells and platforms, reports supporting geologists’ interpretations of the seismic data, and a system of scores assigned to the basins based on their potential. This diverse information resided in a huge collection of isolated spreadsheets, databases, GIS files, and in industry-specific software that only a handful of OilCo’s employees could use.
To manage and present the data, the Exploration Department had created an interactive PowerPoint document. After a year and a half, it contained over 800 linked slides. And with more wells being drilled, and more seismic data on the way, it was growing. “Just maintaining it was a full-time job,” said Mike White,Team Lead – Technical Services, Information Technology, Information Management for OilCo.
The Solution:
At an annual conference, members of the Exploration leadership group viewed the Newfoundland & Labrador Oil & Gas Industries Association’s (NOIA, now EnergyNL) East Coast Map, an interactive visualization of oil and gas activities in the Atlantic. The interactive map was created by ICI Innovations, using its ReportViz software.
ReportViz is a platform for building map-focused reporting solutions that organizations can use to increase strategic insight and make informed decisions. It unites typically isolated information from multiple sources and systems on an interactive map, and allows users to navigate and analyze through a number of methods (e.g., timeline, charts, and graphs, etc.). Major corporations in industries such as renewable energy, mining, and logistics use ReportViz to connect diverse data and gain a holistic view of their operations. ReportViz was used to create OilCo’s Insight solution, which is available to the public at insight.oilconl.com.
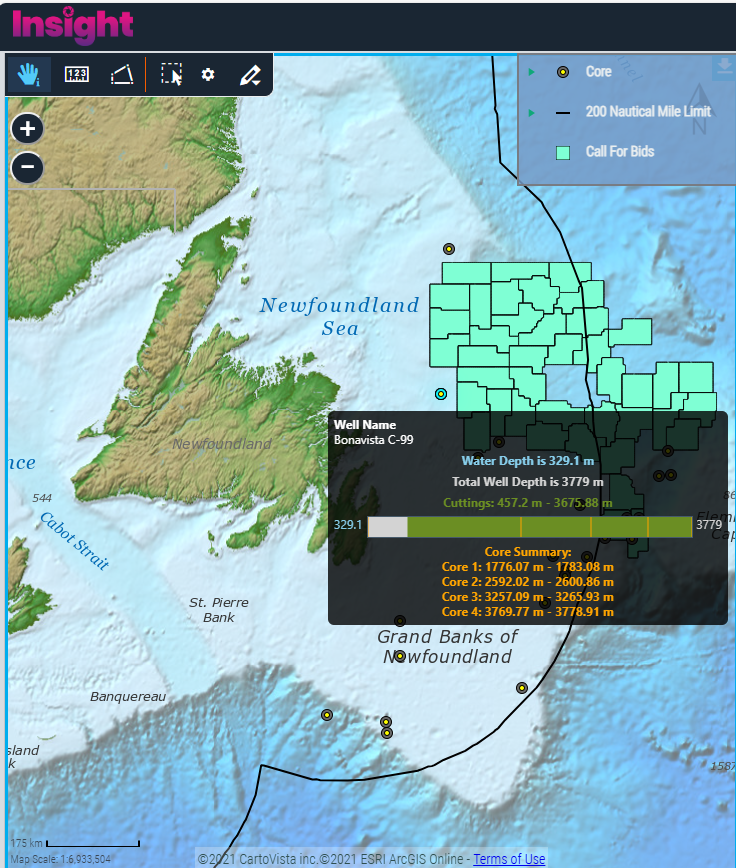
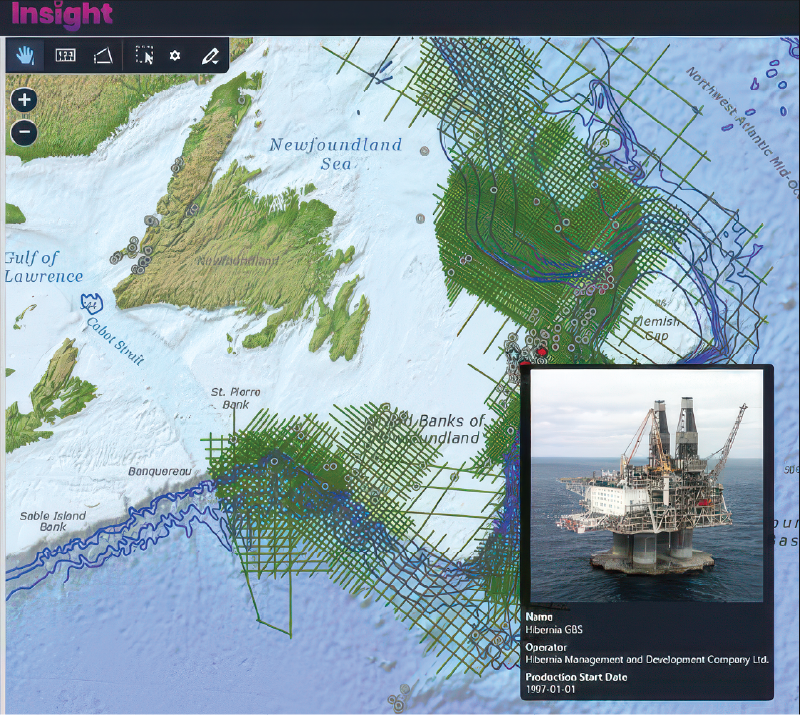
Insight lets users see the locations of basins, wells, and platforms; then sort and filter the information in multiple ways, and access related information on each map item.
Clicking on an oil well, for example, lets users see depth, age, operating company, and amount of oil or gas produced. Seeing NOIA’s map enabled OilCo’s Exploration team to envision a solution to their data challenges using a product that could leverage the work that they had already done.
Building on the work done by OilCo to develop a standards-based collection of industry data, ICI Innovations worked with OilCo’s Exploration Team to develop a solution that addressed all their needs.
Benefits:
Oilco and its employees realize the benefits of ReportViz through:
- A single, easy-to-access location for all information. Insight consolidates more than 50 layers of unique data, bringing together everything from geophysicists’ reports to well status and production figures. Users can filter through this data to find exactly what they want using simple user-friendly controls. New data and data sources can be added to the solution with minimal effort.
- Integration of existing data sets and documents. The solution integrated OilCo’s existing information from multiple sources, in multiple formats without requiring complicated data migration processes.
- A quality user interface that enables compelling presentations. The solution provides a compelling overview of OilCo’s interpretation of possible oil and gas deposits, then lets users show the seismic data and analysis documents that support the interpretation.
“ I don’t know of anyone in our part of the industry using anything like this, where all the data can be shown on one map. The ‘wow’ factor is big in presentations.”
ICI Innovations
Better information flow so customers achieve goals faster
Its ReportViz application is part of the larger RIVAS solution for project information management. It provides access to sophisticated data and reports so project information can be managed and communicated more effectively.
ReportViz is a complete digital EIA and interactive data visualization solution that is tightly integrated with Microsoft 365’s SharePoint Online platform. ICI Innovations has a solid reputation for providing easy to use, yet powerful solutions that support various natural resource-based industries, including energy.
“OilCo has a tremendous amount of data. Data sharing was complicated, and search near impossible. It’s exactly the kind of challenge that ReportViz solves elegantly.”
“The NOIA map gave us an idea of what was possible, and we realized we could take it further. This provides much better management of our resources, both data and people. And with the click of a mouse button, anyone can use it.”


