Regional Assessment for Offshore Drilling
Impact Assessment Agency of Canada
In August 2019, the Impact Assessment Agency of Canada (IAAC) awarded a contract to ICI Innovations (ICI) for the development of a dynamic interactive reporting system, following a Request for Proposals.
Vast and Complex Data – Accessed and Visualized with Ease
The system was for use by the public and industry as part of IAAC’s Regional Assessment of Offshore Oil and Gas Exploratory Drilling East of Newfoundland and Labrador (RA). RA users needed to comprehend complex and disparate data in a simple and visual manner. A flexible model for integrating regional geospatial and tabular data was defined to achieve this meaningful interaction.
The Solution:
CORE FUNCTIONALITY:
Environmental information at various spatial and temporal scales
Results of environmental effects analysis
Non-geospatial information (e.g. text, figures, graphs, and tables), related to data that may be mapped or visualized
Additional system requirements included:
- Simple, quick, and repeatable processes for loading data of various formats into the system for the development of map layers
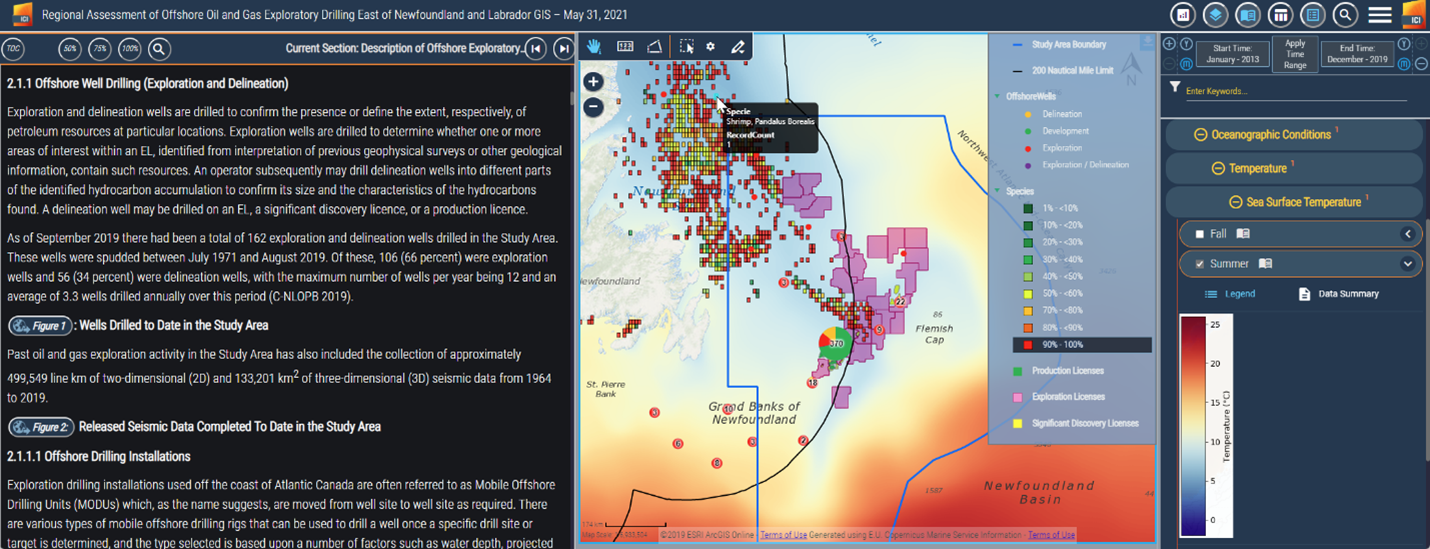
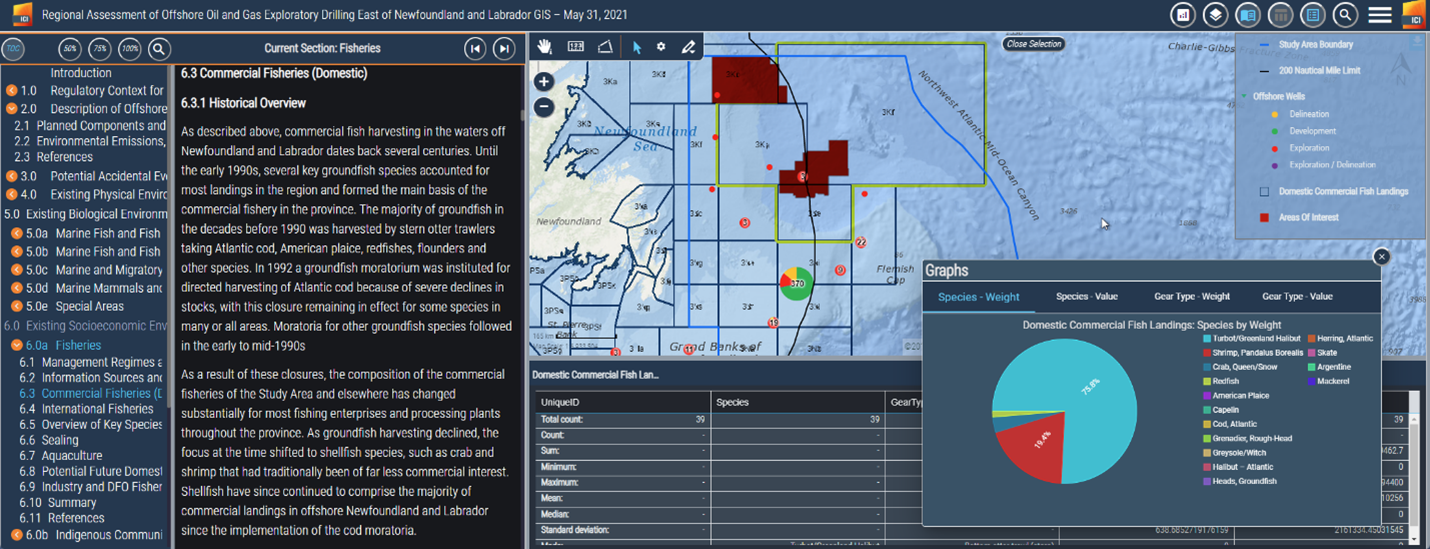
- Easy, yet powerful data exploration techniques such as sophisticated cartographic display, charts linked to map features, and intuitive methods for accessing feature attributes
- Advanced filtering of available data using easily defined parameters such as a range-in-time, map display extents, and/or data specific metadata
- Support of specific needs that are not typical of out-of-the-box mapping solutions
- Rapid development schedule support to accommodate changes and feedback provided by stakeholders and the RA Committee
Delivering innovative and highly interactive data visualization solutions for customers such as the Oil and Gas Corporation of Newfoundland and Labrador (Oilco) provided the experience ICI required to deliver RIVAS-ReportViz as the platform for the RA. RIVAS is ICI’s project information management solution which includes the software system plus rapid implementation and on-going support services by our multidisciplinary team. ReportViz, our flagship reporting and visualization module, offers a new and enhanced user experience to those familiar with a typical mapping application’s user interface.
Features include:
- Navigation Panel for review of report contents linked to the display of associated map layers
- Report contents authored in Microsoft Word and automatically published in ReportViz, without additional formatting or export, including links to figures and live map views
- Layer control supporting thematic groups, with expanded layer options, including:
• Filters that adjust the display of available features based on selected values
• Expanded graphing capabilities and summary statistics tables
• Data summary link providing source and additional details (metadata)
• Temporal control to easily define a date range used to filter features and data within layers - Dynamic query of very large datasets within a relational database management system (Microsoft SQL Server)
- Interactive spatial analysis using features available from displayed map layers or user-defined features
The final ReportViz application for the RA provided a comprehensive mapping solution for a large area of Canada’s eastern offshore environment. The application was delivered within budget at the completion of IAAC’s first regional assessment in May 2020. With over 200 unique layers, the solution offered unprecedented access to a wide array of information related to the region’s physical, biological, and socioeconomic environments. Rather than providing a typical document containing static figures of geospatial data, the RA application provided extensive information linked to an easy-to-use, yet powerful mapping solution enabling the public to explore data and layer interactions with better information flow. The result was an improved understanding of the potential effects of exploration drilling activities for offshore Newfoundland and Labrador.
ICI Innovations
Better information flow so customers achieve goals faster
Its ReportViz application is part of the larger RIVAS solution for project information management. It provides access to sophisticated data and reports so project information can be managed and communicated more effectively.
ReportViz is a complete digital EIA and interactive data visualization solution that is tightly integrated with Microsoft 365’s SharePoint Online platform. ICI Innovations has a solid reputation for providing easy to use, yet powerful solutions that support various natural resource-based industries, including energy.
“The ICI system was absolutely key to the successful completion of the Regional Assessment, allowing the development and release of an interactive publicly accessible reporting and data visualization tool. It allowed for effective and efficient integration of text, data and mapping, and provided a great balance of functionality, analytical features, user friendliness, and the ability to incorporate numerous, very diverse datasets. We received great advice and support from the ICI folks in turning vision into reality, and I would not hesitate to use or recommend this system for future applications.”


